Loading...
Welcome to CoDEx Viewer!
(Cortical Development Expression Viewer)
Getting Started: See help items below or choose an option from drop down menu
Intro
Welcome to CoDex (Cortical Development Expression) viewer! This resource comprises a single-cell expression dataset of the developing human neocortex. Here you can explore the dataset using heatmaps, tSNE’s, distribution graphs and statistical summary tables. In addition, you can explore which genes are differentially expressed for a given cell type during cortical development.


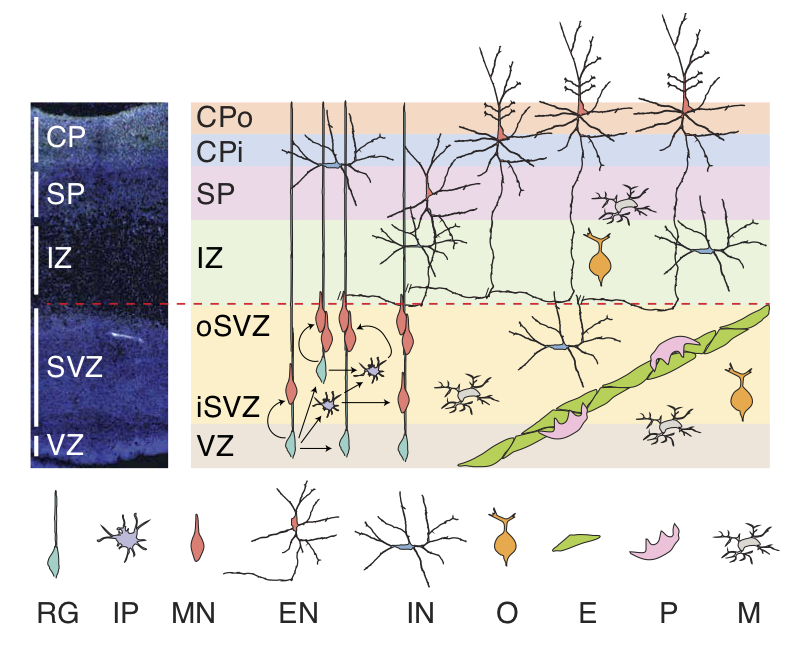
| Schematic of the developing human neocortex. VZ: ventricular zone; iSVZ: inner subventricular zone; oSVZ: outer subventricular zone; IZ: intermediate zone; SP: subplate; CPi: inner cortical plate; CPo: outer cortical plate; RG: radial glia; IP: intermediate progenitor; MN: newborn migrating excitatory neuron; EN: excitatory neuron; IN: interneuron; O: oligodendrocyte precursor; E: endothelial cell; P: pericyte; M: microglia. | Scatter plot visualization of cells after t-stochastic neighbor embedding (tSNE), colored by cell type annotation. |
About
This dataset was generated by Geschwind Lab. This webtool was built using R Shiny by Andrew Elkins. To view our associated publication:
A Single-Cell Transcriptomic Atlas of Human Neocortical Development during Mid-gestationDamon Polioudakis†, Luis de la Torre-Ubieta†, Justin Langerman, Andrew G. Elkins, Xu Shi, Jason L. Stein, Celine K. Vuong, Susanne Nichterwitz, Melinda Gevorgian, Carli K. Opland, Daning Lu, William Connell, Elizabeth K. Ruzzo, Jennifer K. Lowe, Tarik Hadzic, Flora I. Hinz, Shan Sabri, William E. Lowry, Mark B. Gerstein, Kathrin Plath, Daniel H. Geschwind
Abstract
We performed RNA sequencing on 40,000 cells to create a high-resolution single-cell gene expression atlas of developing human cortex, providing the first single-cell characterization of previously uncharacterized cell types, including human sub-plate neurons, comparisons with bulk tissue, and systematic analyses of technical factors. These data permit deconvolution of regulatory networks connecting regulatory elements and transcriptional drivers to single-cell gene expression programs, significantly extending our understanding of human neurogenesis, cortical evolution, and the cellular basis of neuropsychiatric disease. We tie cell-cycle progression with early cell fate decisions during neurogenesis, demonstrating that differentiation occurs on a transcriptomic continuum; rather than only expressing a few transcription factors that drive cell fates, differentiating cells express broad, mixed cell-type transcriptomes before telophase.By mapping neuropsychiatric disease genes to cell types, we implicate dysregulation of specific cell types in ASD, ID, and epilepsy. We developed CoDEx, an online portal to facilitate data access and browsing.
Heatmap
tSNE
Distributions
Tables
Cell Types
Data normalization
Help and Feedback
Help
Download help doc here
Feedback
If you have feedback or want to report a bug please email aelkins[at]mednet.ucla.edu
Cell Types

Data Download
The download contains the raw counts (UMI) gene expression matrix and metadata:
Download dataThe count matrix (raw_count_mat) is stored as a sparse matrix in an rdata file. To convert to matrix use the "Matrix" package using R.
library(Matrix)
# load in sparse matrix
load("../sc_dev_cortex_geschwind/raw_counts_mat.rdata")
raw.counts.mat <- as.matrix(raw_counts_mat)
The raw Drop-seq data was processed using the Drop-seq tools v1.12 pipeline from the McCarroll Laboratory. Reads were aligned to the Ensembl release 87 Homo sapiens genome. We calculated unique molecular identifier (UMI) counts for each gene of each cell by collapsing UMI reads using Drop-seq tools.
To select Drop-seq cells for downstream analysis:
1) Cells were selected for downstream analysis using the cell barcodes associated with the most UMIs. We estimated the number of cells captured as 5% of the input beads and retained this many cell barcodes for downstream analysis.
2) For samples with mouse cells spiked in, mouse cells were removed by filtering all cells with > 250 UMIs mapping to the mouse genome.
3) Removed cells with <200 unique genes detected (gene detection: >=1 count).
4) Removed cells with >3 standard deviations above the mean number of genes detected (3152).
5) Removed cells with >5% of their counts mapping to MT genes.
6) Removed genes detected in <3 cells.